Rapid Decision Tree and Expert‑System Generation
FastChart enables authors to create a VisiRule chart from historical data. Historical data often contains hidden trends and patterns. FastChart can exploit machine learning algorithms to generate an initial VisiRule chart.
FastChart overview
FastChart provides a rapid way to turn structured knowledge into a working decision model. It lets subject‑matter experts create rule‑based flows directly from tabular data, spreadsheets, or structured lists—without drawing diagrams or writing code. This makes it ideal for quickly prototyping expert systems, decision trees software, diagnostic troubleshooting tools, triage pathways, and guided questionnaires.
FastChart automatically converts your structured content into a VisiRule chart, complete with logic, branching, and question flow. You can then refine, publish, and deploy the model using the full VisiRule toolchain.
Why FastChart matters
FastChart accelerates the early stages of expert‑system development by removing the need to manually build diagrams. This is especially useful when:
-
knowledge already exists in spreadsheets, tables, or checklists
-
you need to prototype a decision model quickly
-
multiple variations of a model must be generated
-
domain experts want to contribute without learning modelling tools
By automating chart creation, FastChart reduces development time and ensures consistency across models.
How FastChart works
FastChart reads structured content—such as CSV files, spreadsheets, or formatted text—and interprets:
-
questions
-
answer options
-
branching logic
-
scoring rules
-
conditions and thresholds
It then generates a complete VisiRule chart that can be opened in VisiRule Author for refinement. This allows teams to move from raw knowledge to a working expert system in minutes.
Benefits of using FastChart
FastChart delivers several advantages for organisations building expert systems:
-
Speed — generate decision models instantly from existing content
-
Accuracy — reduce manual transcription errors
-
Consistency — enforce uniform structure across multiple models
-
Accessibility — empower non‑technical experts to contribute
-
Scalability — produce many variations of a model quickly
-
Integration — refine and publish using the full VisiRule platform
This makes FastChart a powerful accelerator for knowledge engineering and decision‑automation projects.
Step 1 - Induce Your Rules
You can use existing machine learning tools and packages to generate a decision tree.
This tree is then exported as PMML.


Step 2 - Import Tree Data
VisiRule FastChart will import your decision tree and convert it into a form which VisiRule can use.
VisiRule FastChart will identify the rules contained in the PMML decision tree and transform them into an internal format.
Step 3 - View Imported Tree
VisiRule will rebuild a visual tree based on the imported data.
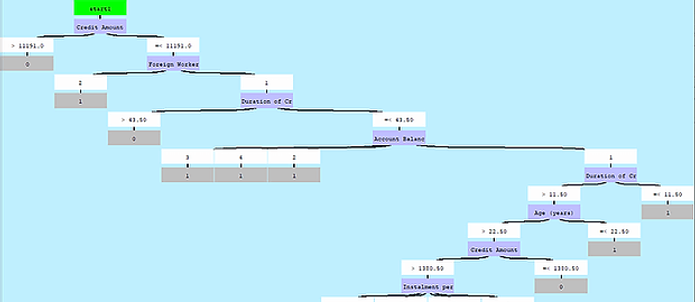

Step 4 - Generate VisiRule Chart
Using the tree view, VisiRule FastChart will then create a brand new VisiRule chart - just as if you had drawn it.
Complex Charts
You can then extend, adapt your initial chart as you wish, combine it with other questions and logic or attach explanations and additional computations.


ChatBot Delivery
Once you have your VisiRule chart, you can deliver as a web-based expert system, or as an interactive chatbot